

Earlier today, President Trump denied rumors that the U.S. was going to roll back Chinese tariffs – something that was agreed to by both sides, according to Chinese Commerce Ministry spokesman Gao Feng.
But Trump says it’s total bunk. No agreements have been made, and more importantly, the U.S. isn’t ready to let China off the hook.
So, unsurprisingly, investors are getting nervous. A couple of weeks ago, it looked like a “phase one” trade deal was in the works.
Then, last week, it wasn’t.
And yesterday, Gao Feng said that tariffs were going to be reduced.
Now, not so much. Trump acknowledged that while China may want a de-escalation, the U.S. doesn’t.
Not yet, at least.
Confused? So is Wall Street, along with scores of investors, all of whom have based their recent investing decisions on trade war headlines.
And while that’s made long-term investing frustrating for many, it’s also made short-term trading a very rough affair. Over the last few weeks, finding trends has been likened to pulling teeth – equal parts painful and difficult.
Thankfully, we’ve been able to identify several fantastic trade setups in that time period, but it’s required far more legwork than normal.
And when the going gets tough (like it currently is), instead of looking for traditional setups, I like to change my “trade finding” approach by searching for stocks that enjoy large breakouts after periods of indecision.
As luck would have it, I found one that fits the bill:
American International Group (NYSE: AIG), or as it’s more commonly known, AIG.
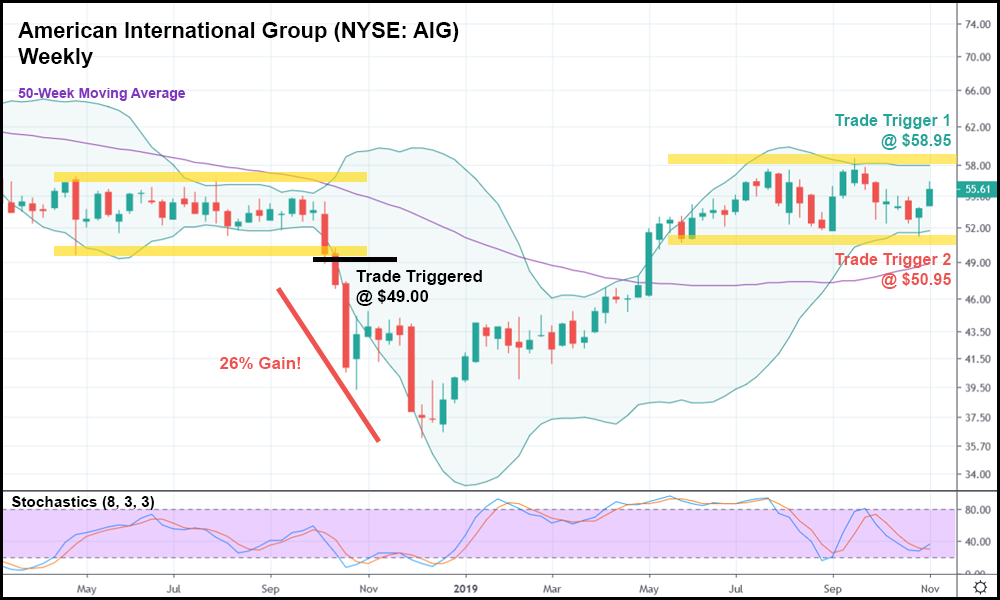
In the weekly candlestick chart above, you can see that AIG had a huge breakout trade last October/November. The stock was chopping sideways, unable to pick a direction for months. That all changed in October, however, when AIG dropped with the rest of the general market.
After AIG shares surpassed key support at $49.00, we went short, raking in a handsome 26% gain. Had you purchased and appropriately priced and dated put option, you would have easily seen triple digit gains from that trade.
And now, more than a year later, AIG’s caught in the same pattern. Share prices are bouncing back and forth between a tight range looking to break out once they move past either support OR resistance. This stock could certainly go either way.
Based on AIG’s recent activity, it looks like an upside breakout might be more likely. However, just in case the stock does drop, I wanted to include both trade triggers (to go long or short) in the event that AIG craters.
If resistance is taken out, it might make sense to go long at $58.95. If support is taken out, it might make sense to go short at $50.95. Either way, AIG appears ready to move quickly.
Whether that’s a freefall or “moonshot” has yet to be seen. Last year, this same kind of setup worked out beautifully for opportunistic traders.
Will lightning strike twice? At this point, it looks like it will.
It’s just a question of “when?”


