

We predicted it last week, and sure enough, it’s happened:
The market is starting to crumble.
Pushed arguably too high by overzealous bulls, equities are coming back down to earth. President Trump made some controversial remarks at this morning’s London NATO summit, and in doing so, erased a significant chunk of market cap instantly.
What investors had a particularly tough time with was his remarks about the trade war, which he now says might not see a partial trade deal until after the 2020 election.
“In some ways, I like the idea of waiting until after the election for the China deal, but they want to make a deal now, and we will see whether or not the deal is going to be right,” Trump told reporters before the market opened.
To absolutely no one’s surprise, stocks sunk at the start of today’s trading session. Every major index got hammered as their losses from yesterday continued.
Some analysts are already jumping back on board, saying that Trump’s statement this morning should be taken with a grain of salt. Today’s losses are a slight “road bump” that will get smoothed out by Christmas.
However, the charts are telling us something else entirely – that the NATO summit-driven plunge isn’t just a knee-jerk reaction, but potentially the start of a significant downtrend.
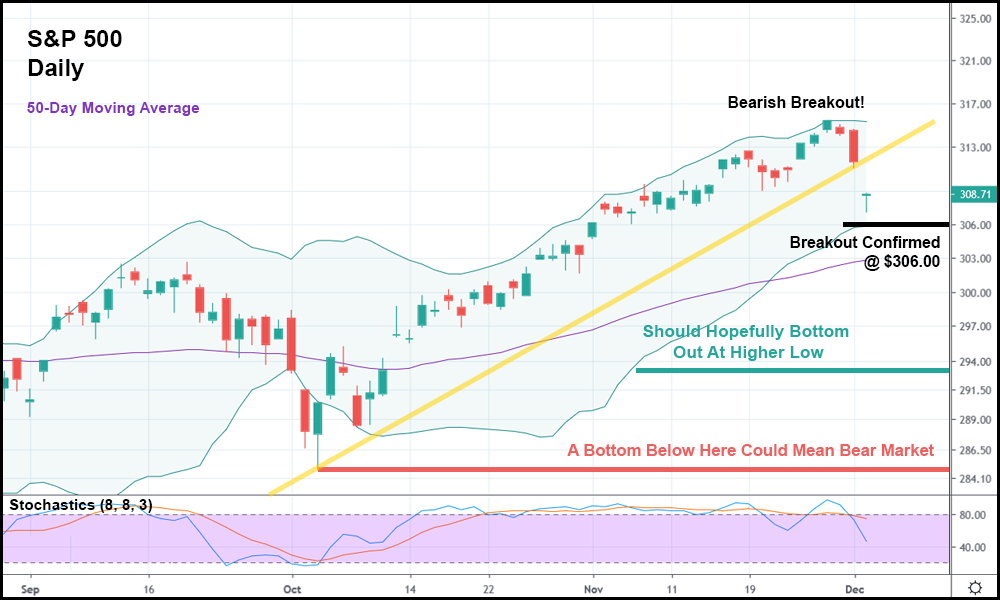
In the daily candlestick chart above, you can see that today’s drop (as reflected in the S&P 500) completely blew past the lower trendline tracing the standout lows of the current trend.
As it stands, another fall below today’s low (to $306.00) would likely confirm that a bearish breakout is in full effect. Going short at this point, if you’re so inclined, might make sense. An appropriately priced and dated SPY put option could do very well if this truly is the start of something more sinister.
The S&P 500 hit the upper Bollinger Band (BB) before sinking for two days straight. Yesterday’s candlestick was concerning enough, as it closed below the last four candle bodies.
Those two things combined usually warrant a short position.
But it got even worse this morning when the S&P 500 blew past the standout low trendline, suggesting that a major move is in the works.
And if the S&P 500 does hit $306 tomorrow, the question then becomes, “Where does the selling end?”
Based on what the S&P 500 has done in 2019, I wouldn’t be surprised to see it bottom out at a higher low relative to the low of early October. All year, the indexes have gone on prolonged rallies, followed by abrupt corrections to higher lows.
This time (hopefully for bulls) will be the same.
However, if the S&P 500 bottoms out below the low from early October, it might be time to buckle down. Not because it’ll keep dropping short-term, but because a bottom that low could signal a longer-term bear market – something we haven’t had in more than a decade.
So, over the next few days, keep a very close eye on the S&P 500 (along with the other indexes) to see what the market does. Investors – both bulls and bears – are in a very precarious spot. What happens next could determine the fate of equities in Q1, possibly Q2 2020.


