

Over the last few months, the market has behaved erratically. Huge weekly (sometimes daily) swings in price have frustrated long-term investors and short-term traders alike. Developing trends have quickly been derailed, or worse, reversed in just a handful of candlesticks, turning otherwise promising trade setups into quick losses.
One way to “screen” out the volatility is to use weekly candlesticks – something that I’ve grown very fond of doing. The results, quite frankly, speak for themselves. Since June, we’ve managed to log a ton of highly profitable trades, while limiting the number of non-starter setups.
And much of our success (or rather, pick accuracy) can be attributed to the formation of triangles – patterns where upper and lower trendlines come to a point. Because of the recent volatility, triangles have been popping up all over the market, much more so than in recent years, leading to plenty of huge, breakout moves from certain stocks.
Now, don’t get me wrong; not every triangle has worked out for us. Some of them just ended up chopping sideways.
But others had massive payoff potential, and when the underlying stock moved past our trade trigger, big gains were waiting on the other side.
Which brings me to today’s featured stock – SLM Corp. (NASDAQ: SLM) – a company whose shares are ready to “leap” off the charts.
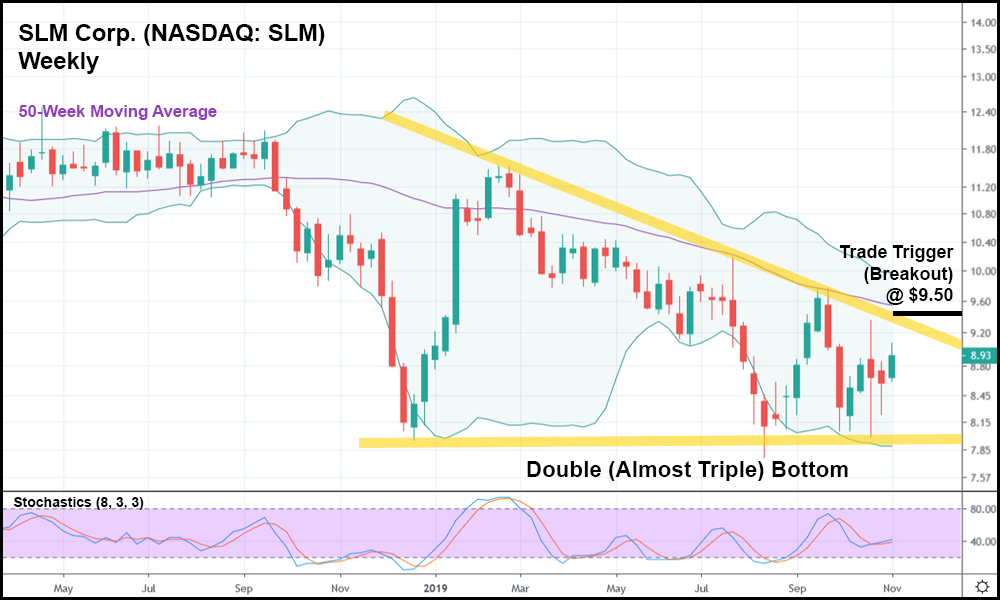
In the weekly candlestick chart above, we have a classic descending triangle. Key support has been established at the double (almost triple) bottom, while the upper trendline moves downwards, touching the descending standout highs.
The stochastics, while not ideal, support that an upwards move could start soon, and the current weekly candlestick is trading above the last four candle bodies. Usually, that’s all I need to warrant a long position above the current week’s high.
However, in this case, we have a triangle at play, meaning that we really shouldn’t go long until the current price action rises above the upper trendline. Since the trendline is so close to the current price, a long trade could potentially trigger above the current week’s high right before SLM bounces off that same trendline back downwards, putting us into a “going nowhere” position.
In addition, the 50-week moving average is trending downwards, meaning that SLM needs to show a little more life before we go long.
So, in light of the triangle’s presence, it might make more sense to take this trade at $9.50, above the upper trendline, and into “breakout” territory. If SLM can rise above that price point, it’ll have plenty of room to run over the next few months.
Potentially into a trend reversal that returns double (or even triple) digit gains.


