

It’s 2019, and imitation meat has never been more popular.
Vegetarians, vegans, and even some omnivores have turned to it as a way of satisfying their more carnivorous desires.
And while it’s true that “faux meat” has been around for a while, the old stuff (think Boca Burgers) never really came close to matching real meat’s texture or taste.
At least, until Beyond Meat’s (NASDAQ: BYND) products hit store shelves. Back in 2015, they released the “Beast Burger”, a soy-free, plant-based vegan burger that imitated ground beef. Then, a year later, they came out with an improved version of the burger, placing it alongside beef, poultry, and pork in the meat section of grocery stores – a first for imitation meat products.
Finally, in May 2019, the company IPO’d and has rewarded early investors very handsomely since. At its highest point, shares were trading over 700 above BYND’s IPO price.
But since topping out in July, BYND is finally coming back down to earth. Analysts warned that the company’s valuation was completely out of line with their financials and that a reckoning would soon be coming for the overinflated plant-based meat manufacturer.
And sure enough, just days later, BYND started falling, eventually reaching a critical point in it’s short (but highly volatile) history.
But now, over the last few weeks, a major breakout scenario has formed, which could send BYND on a massive swing in either direction.
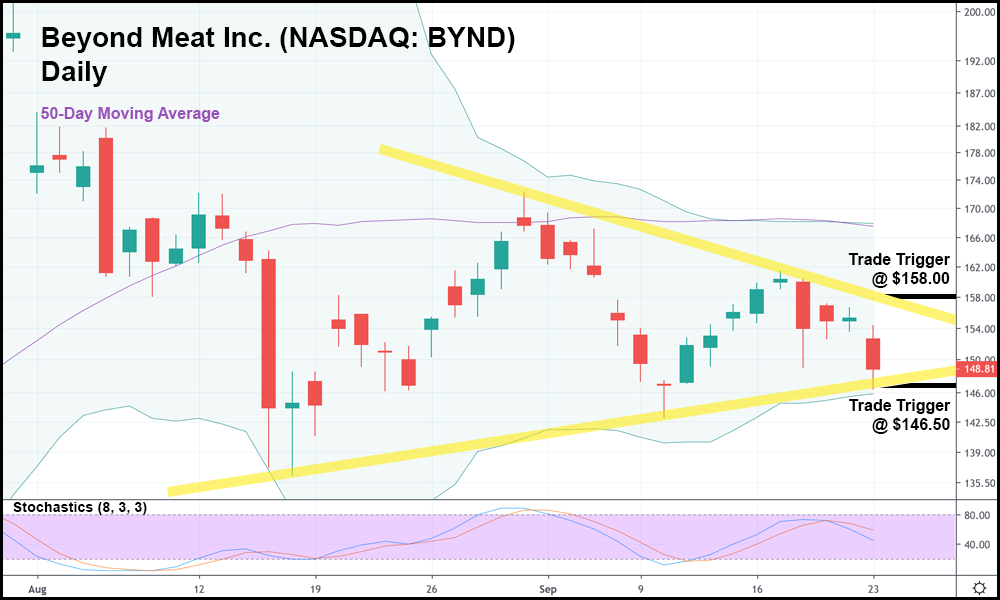
In the daily candlestick chart above, you can see that BYND has worked itself into a classic triangle formation. We’ve featured plenty of triangles in the past, but what makes BYND’s triangle so unique is that this is such a young stock.
What I mean is that with a small amount of trading history, BYND’s price action might not respect previous levels of resistance or support as much as an older stock would.
Not only that, but BYND has shown that it’s a very fast mover, suggesting that a breakout above or below the sideways chop of the last few weeks could have huge implications on where the stock is headed.
In this case, we’ve set trade triggers at $158.00 and $146.50 – both just outside the upper and lower trendlines.
Should BYND move past either of those points, going long or short might make sense. More importantly, if one of those price points gets taken out and BYND reverses to the other direction, entering a trade at the other trade trigger might also be prudent.
It’s been an exciting year for BYND investors already, but once this stock makes its next move, we could see a breakout for the history books.
One that we managed to identify before it even got close to hitting “exit velocity”.


