

After a massive jobs report released this morning, equities soared. Unemployment is at a 50-year low, and, according to the U.S. Labor Department, November payrolls increased 266,000 – well above the 187,000 expected gain.
All in all, it was another great sign that the bull run could continue, and that a recession may have officially been avoided. Wall Street cheered the fantastic numbers, as investors and analysts alike set their sights higher to close out the year.
And, with today’s gain, the major indexes are now near their all-time highs once again.
Just a few days ago, prior to the release of the jobs report, stocks looked terrible. After hitting the upper Bollinger Band (BB), the market was collapsing in a hurry. Daily losses compounded, and equities were entering correction territory.
If the S&P 500, for example, fell below 3060, we would’ve taken it as an opportunity to go short.
Thankfully, though, the index recovered, and investors now find themselves in the opposite situation:
A chance to go long on a bullish uptrend continuation.
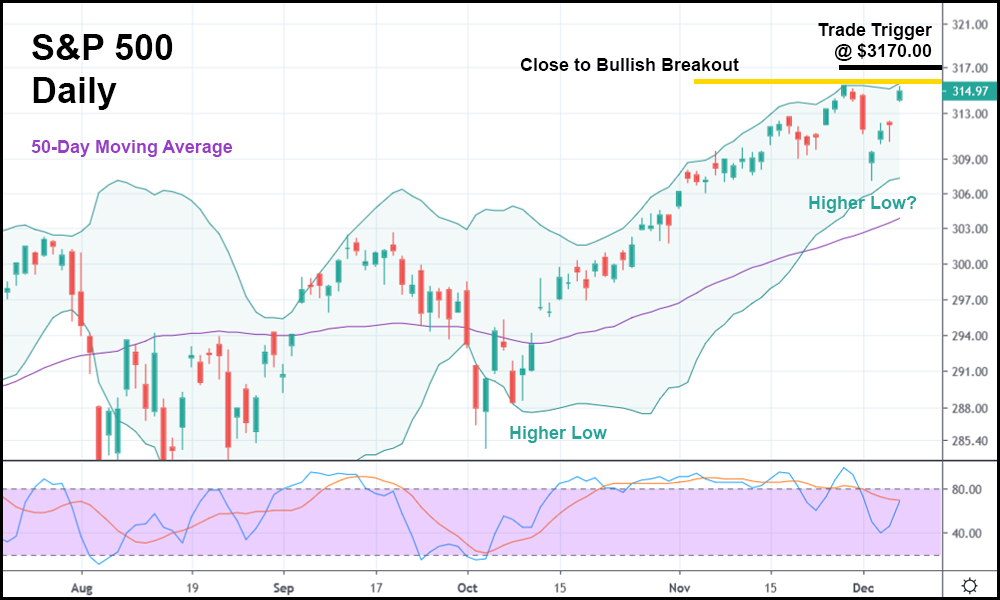
In the daily candlestick chart above, you can see that the S&P 500 (charted as the SPY), after dipping a few days ago, has recovered – today being the best day of the bunch.
Now, near the upper BB, the market is at another critical point. If the index keeps rising – outside of its normal price range, mind you – another rally could be in the works.
And if a daily candlestick closes above resistance at a new all-time high, it might make sense going long, roughly around 3170.00 (or 317.00 for the SPY).
But still, bulls need to be careful here. The S&P (or any traded asset, for that manner) doesn’t usually stay above the upper BB for long. If this run is to continue, it will likely have to do so slowly, or at least with a few sell-offs along the way.
The stochastic indicator is already relatively high, and if it goes much higher, it’ll make the market appear overbought. Yes, it was very high from mid-October to mid-November when the market kept rising, but the index managed to stay within the bounds of the BB.
If the S&P closes above the upper BB several times in a row and the stochastic indicator is higher than 80, it might be time to walk away from the market for a day or two.
Regardless of what happens, though, for now, it looks like a correction is out of the cards. The market may end up chopping sideways temporarily before rising again, but unless it crests our trade trigger, a protracted upwards move seems unlikely.


 In Trouble Again")
